Isochrone catchment area: everything you need to know (and how to draw it without GIS software)
Isochrone, circle, isodistance: which method should you use for your catchment area? Complete guide with sector benchmarks and a case study.
Published on · 9 min read
When people talk about a catchment area, they often picture a simple circle on a map. In reality, that circle almost never reflects what happens on the ground. A customer 2 km away might take 5 minutes or 30 minutes to reach you depending on the neighborhood, the time of day, and their mode of transport. That's exactly where the isochrone comes in — and that's what makes it the reference method for any serious commercial analysis.
What you'll learn
- The concrete difference between a circle, an isodistance, and an isochrone
- Why the catchment area is the most reliable method for commercial decisions
- Which travel times to use depending on your type of business
- How to read and use a primary, secondary, and tertiary zone
Circle, isodistance, isochrone: what's the difference?
All three methods exist, but they don't produce the same result. Choosing the wrong one can skew your entire analysis.
The kilometer-radius circle
This is the most widespread method because it's the simplest to draw. You define a radius of X kilometers around your point of sale, and you get a perfect disc on the map.
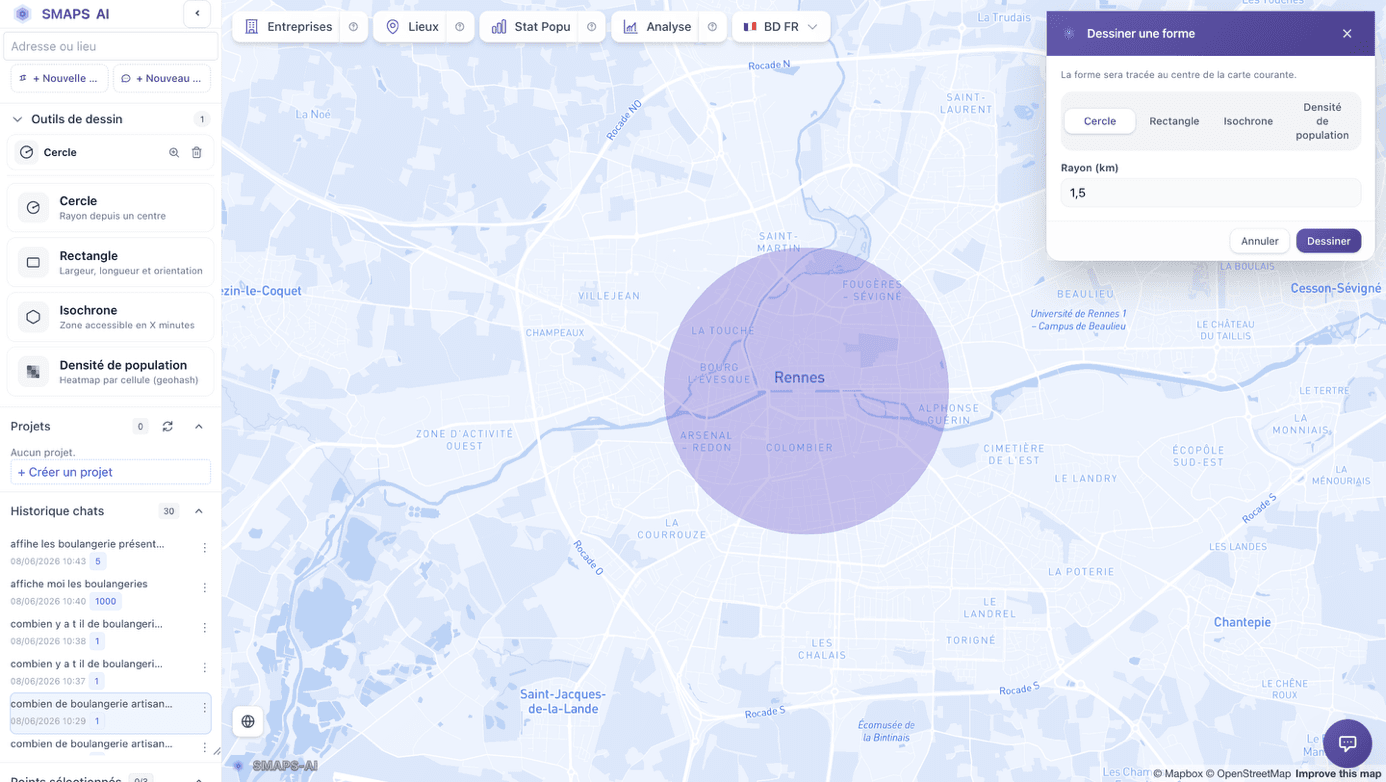
The problem: a circle ignores every obstacle. A river, a railway, a highway with no nearby exit — all of that disappears. A shop next to the Seine with only one bridge 1.5 km away will have a real zone far more asymmetric than the circle suggests.
When to use it: for a quick first approximation, or to compare zones at the national scale where local details don't matter. Never to pick a specific location.
The isodistance
The isodistance draws the area reachable within a given actual distance along the road or pedestrian network, not as the crow flies. It's more precise than the circle, but it still ignores time: a 4 km distance can be covered in 6 minutes on a highway or 22 minutes in a congested city center.
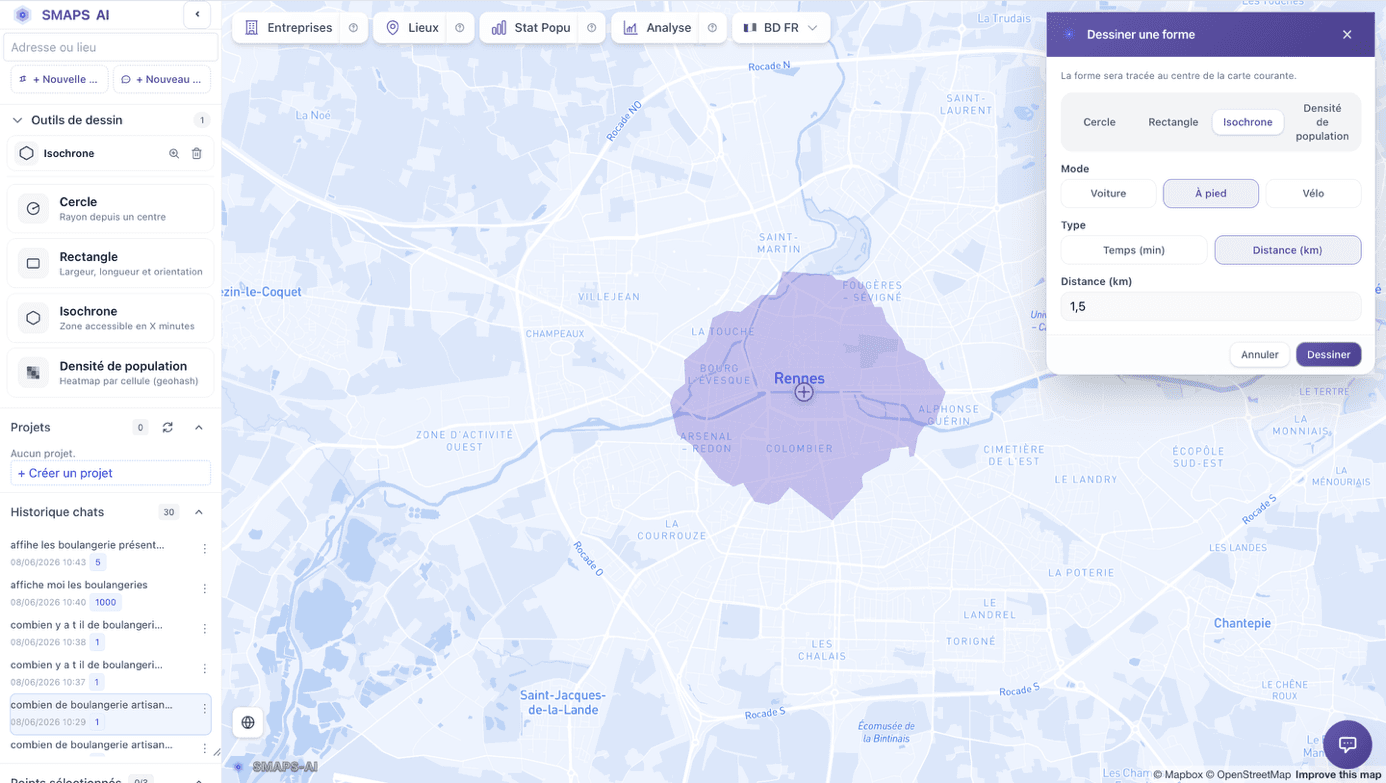
The isochrone
The isochrone draws the area reachable within a given time, for a specific mode of transport. It also corresponds to a shop's actual catchment area. It accounts for real speeds on each road segment, traffic lights, 30 km/h zones, one-way streets, and urban barriers. It produces an irregular shape that matches ground reality.
A shop near a highway exchange will have a very elongated isochrone in the direction of fast roads. A shop in a pedestrian historic center will have a compact isochrone, often smaller than expected.

It's the only method that reflects the real behavior of your customers.
Which mode of transport should you pick?
Choosing the transport mode matters as much as choosing the time. It depends directly on your customers' profile and your shop's location.
| Context | Recommended mode |
|---|---|
| Shop in dense city core | On foot |
| Neighborhood restaurant | On foot or by bike |
| Suburban supermarket | By car |
| Urban gym | On foot + by car (two isochrones) |
| City-center pharmacy | On foot |
| Car dealership | By car |
| Out-of-town retail park | By car only |
Common mistake: using a car-based catchment area for a shop most customers reach on foot. The result massively overstates the real zone and leads to overly optimistic revenue projections.
The three zones: primary, secondary, tertiary
Once you've chosen the catchment area, you split it into three rings. This split reflects step changes in buying behavior. Beyond a certain distance or time threshold, visit frequency doesn't decline gradually — it drops in steps.
Primary zone — the core of your customer base
The primary zone is the closest. This is where your most regular customers live — the ones who come out of habit, by proximity reflex. It typically accounts for 50 to 70% of revenue.
A competitor opening in your primary zone is a direct, immediate threat. A customer 3 minutes away on foot will easily try the alternative across the street.
Orders of magnitude by sector:
| Sector | Primary zone |
|---|---|
| Bakery, café, newsagent | 300–500 m on foot |
| Hair salon, beauty | 800 m – 1.5 km |
| Lunch restaurant (city center) | 400–800 m on foot |
| Dinner restaurant | 1–2 km by car |
| Pharmacy | 500 m – 1.5 km |
| Gym | 5–10 min by car or foot |
| Neighborhood supermarket | 800 m – 1.5 km |
| Shopping mall | 5–10 min by car |
| Car dealership | 15–25 min by car |
Secondary zone — the customers who choose
The secondary zone attracts less regular customers, typically once a month or less. They come for a specific reason: a differentiated offer, better value, longer hours, an exclusive service. They actively choose between several alternatives at comparable distance.
It represents around 20 to 30% of revenue. But for many destination retailers (dinner restaurants, gyms, fashion stores), it can climb to 35–40% and represent the main growth margin once the primary zone stabilizes.
What brings a customer in from the secondary zone:
- An offer they can't find elsewhere in their primary zone
- A clearly lower price than local competition
- Hours or services that fit (click & collect, delivery, online booking)
- Reputation (Google reviews, friend's recommendation)
Tertiary zone — passers-by and destination customers
The tertiary zone covers occasional customers: tourists, people passing through, exceptional trips. Frequency is low: one to four times a year at most.
For most local shops, it counts for little in total revenue. But for some formats, it's structural:
- Gourmet restaurants or unique concepts: customers come on purpose, accept a long trip
- Concept stores and craft boutiques: factories, vineyards, renowned pastry chefs
- Regional shopping malls: tertiary zone reaching up to 30 minutes of travel
For a neighborhood bakery or a standard pharmacy, don't dwell on the tertiary zone: over 80% of revenue will always come from the first two zones.
Which travel times for each zone?
There's no universal rule, but there are orders of magnitude that the location-analysis industry generally agrees on. Adapt them to your sector and positioning.
| Commercial format | Primary | Secondary | Tertiary |
|---|---|---|---|
| Pedestrian shop (city center) | 5 min on foot | 10 min on foot | 20 min on foot |
| Car-based shop (suburban) | 5 min by car | 10–15 min by car | 20–30 min by car |
| Regional chain | 15 min by car | 30 min by car | 60 min by car |
| Dinner restaurant | 5 min on foot | 5–8 min by car | 15 min by car |
These durations are starting points. The best calibration is the analysis of your real customers: if you already have an open shop, the postcodes of your customer base validate or correct these theoretical assumptions.
What the isochrone does not replace
The isochrone delimits the potential catchment area. But it doesn't tell you how many people live there, what their profile is, or how many competitors are already there.
To turn a zone into a decision, you cross the catchment area with other data layers:
- Sociodemographic data (age, income, household composition) to qualify potential: a zone of 10,000 inhabitants where 70% are retirees won't fit the same brands as a young, active zone
- Direct competitor density per zone, to identify saturated markets and under-equipped opportunities
- Traffic generators: train stations, schools, markets, business parks. Their presence or absence in the primary zone can double or halve traffic.
Case study: a bakery franchise in a mid-sized city
A founder wants to open an industrial bakery franchise in Amiens (northern France). She hesitates between two locations: a residential neighborhood (Henriville) and the city center (Les Halles).
For each address, she draws a 5-minute pedestrian isochrone.
| Residential (Henriville) | City center (Les Halles) | |
|---|---|---|
| Dominant profile | Retirees, upper-class, families | Young (15–29), retirees |
| Direct competition | 1 bakery | 9 bakeries |
| Traffic generators | High school, football stadium | Museums, cinema, market hall |
Reading the catchment areas shows that the city center offers a dense pedestrian primary zone, well-suited to a bakery whose target customers come on foot — but with heavy competition. The residential neighborhood has far fewer competitors in its primary zone.
Decision: Henriville. The neighborhood has far fewer competitors with a population that matches the target customer profile of an industrial bakery.
Conclusion
The isochrone isn't a technical gadget reserved for location-analysis software. It's simply the most honest way to represent the real market of a point of sale. Drawing a circle is telling yourself a story. Drawing a catchment area is facing reality.
The good news: just a few years ago, drawing a catchment area required dedicated software and training. Today it's accessible to any founder in a few clicks, without technical skills.
Draw your first catchment area free on SMAPS-AI.
app.smaps-ai.com