Contents
Nine out of ten businesses that close within their first three years share one thing in common: they never really checked whether their market existed at the location they chose. A market study is not an administrative formality to secure a bank loan — it's the insurance that you won't invest years and thousands of euros on an unverified assumption. Here's the complete method, step by step.
What you'll learn
- The 6 essential steps of a market study before opening a business
- How to estimate the real size of your local market
- How to analyze the competition and the profile of your future customers
- How to turn this data into a location decision
Why the market study is the first thing to do, not the last
Many founders reverse the logical order: they first find a space they like, then try to convince themselves it will work. It should be the opposite.
A market study answers a simple question before you invest: are there, at this precise location, enough potential customers to sustain my business against the existing competition?
It also plays a concrete role for the rest of the project: it feeds the business plan, it reassures banks and investors, and in the case of a franchise it is a legal obligation of the franchisor (in France, the Doubin law, article L330-3 of the Commercial Code) to provide a local market overview. Good news: you no longer need to pay a consultancy to get this information. A large part of this market study can now be done online, for free, with the right tools.
The 6 steps of a market study
Step 1 — Define precisely what you're trying to find out
Before collecting any data, set the questions the study must answer. A market study without a clear objective produces a lot of numbers and no decision. This is even truer when running an online market study: the sheer volume of available data can quickly become a trap if it isn't guided by precise questions from the start.
The basic questions to ask:
- What is the size of my potential market at this location?
- Who are my typical customers, and how many are reachable from this point of sale?
- Who are my direct and indirect competitors, and how are they positioned?
- What are the consumption trends in my sector (growing, stable, declining)?
- How much do my potential customers spend on average for this type of purchase?
For a bakery project, for example, the objective could be framed like this: how many bakeries already exist in the area, what is their apparent footfall, and what share of local demand remains unmet?
Step 2 — Define your catchment area
Once the objective is set, you need to delimit the geographic area the analysis will cover: your catchment area. It's the zone from which most of your customers will come. Three methods exist to draw it, with increasing precision:
- The kilometer-radius circle: a fixed radius around the point of sale. Fast, but imprecise — it ignores roads, natural obstacles, and urban barriers.
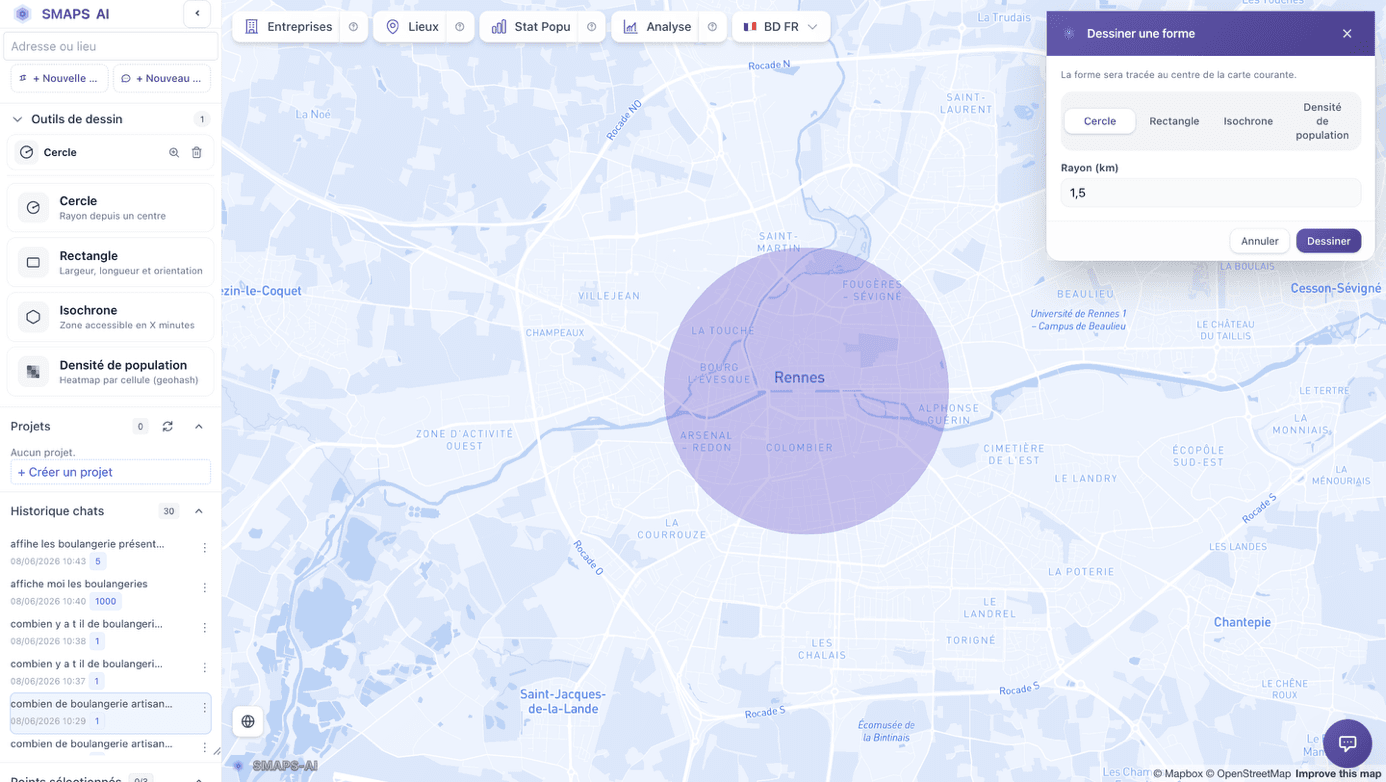
- The isodistance: the zone reachable within a real distance along the road or pedestrian network — more faithful than the circle, but without accounting for travel time.
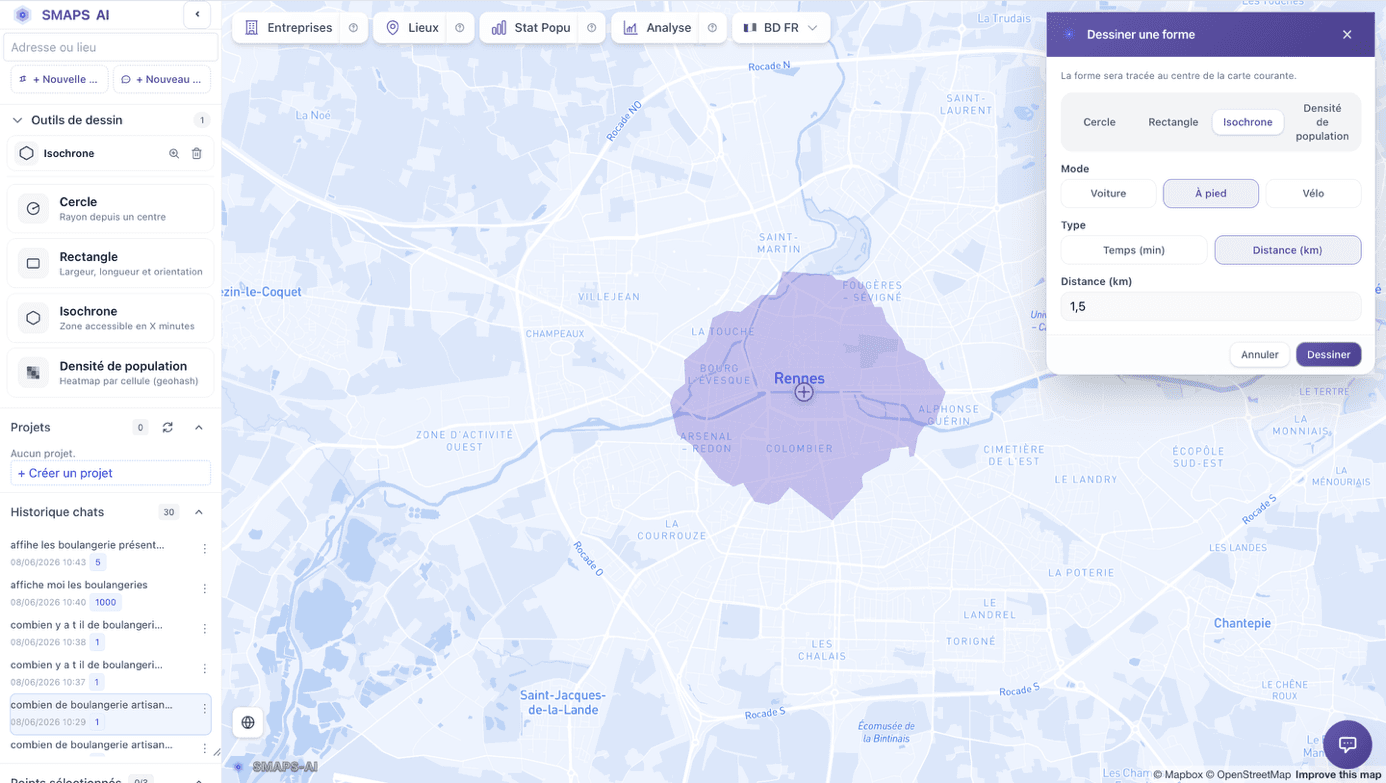
- The isochrone: the zone reachable within a given time (5, 10, 15 minutes), for a specific mode of transport (walking, cycling, driving). It's the most reliable method, because it reflects customers' real behavior.

To go further on choosing the right method and the right travel time for your sector, see our detailed article on the isochrone catchment area.
The right travel time and mode of transport depend heavily on your business:
| Type of business | Mode | Primary-zone time |
|---|---|---|
| Bakery, newsstand, café | Walking | 5 min |
| City-center restaurant | Walking | 5–8 min |
| Gym | Walking + driving | 10 min |
| Supermarket | Driving | 5–10 min |
| Dealership, specialty store | Driving | 15–25 min |
Once the zone is drawn, you can usually break it into three rings: the primary zone (the core of your regular clientele, 50–70% of revenue), the secondary zone (occasional customers who weigh several options, 20–30% of revenue) and the tertiary zone (passing trade, marginal except for destination businesses).
Step 3 — Qualify the population profile in your zone
Once the zone is delimited, you need to know who lives there. This is where public demographic data comes in, and in particular France's INSEE IRIS data — the finest statistical breakdown available in the country, with about 2,000 inhabitants per IRIS and more than 250 indicators (age, income, household composition, socio-professional category, unemployment rate, etc.). This data is freely accessible, which means you can run a free market study up to this stage with no budget at all.
The indicators to look at depend directly on your business:
| Activity | Priority indicators |
|---|---|
| Local food retail | Population density, household size |
| Restaurants | Share of working population, median income, dominant work hours |
| Fashion, décor, home equipment | Median income, socio-professional category, median age |
| Sport, wellness | 20–45 age bracket, upper socio-professional categories |
| Early childhood | Share of families with young children |
| Services for seniors | Share of people over 60 |
A zone with 5,000 young, working inhabitants is not the same market as a zone with 5,000 retirees on modest incomes, even if the population volume is strictly identical. It's this crossing of volume and profile that gives a market study its real value.
Step 4 — Measure real footfall, hour by hour
IRIS data gives a static snapshot: who lives in the zone. But it says nothing about a neighborhood's real footfall at a specific moment of the day. Yet for many businesses, what matters isn't the resident population but the flow of people actually present on site — whether they live there, work there, or are just passing through.
That's what population-density data from mobile networks provides, such as Orange Flux Vision, integrated into SMAPS-AI. The principle: relying on anonymized mobile-network data, the tool estimates how many people are in a given geographic cell, over a 2-hour window, at any chosen time.
Concretely, you can compare a neighborhood's footfall on a Tuesday at 8am, a Saturday at 2pm, or a Friday evening, and observe how the present population varies by time slot. It's valuable data for very concrete decisions: a business that lives off office workers will want to check weekday density at lunchtime, while a leisure or evening-dining business should look at weekend footfall instead.
This approach has already proven itself at scale: Orange used this same technology to size security measures during the Paris 2024 Olympic Games, monitoring population density across about a hundred entry points and Olympic sites. For a business, the use is more modest but just as concrete: spotting peak hours on a shopping street, checking that a targeted space isn't deserted outside office hours, or comparing two locations on their real dynamics rather than on resident population alone.
Step 5 — Analyze local competition
No market study is complete without a precise mapping of the competition, both direct and indirect.
Direct competition includes businesses that offer the same product as you, in the same zone. For each one, try to assess: its seniority, its apparent footfall, its price range, and its visible strengths and weaknesses.
Indirect competition includes businesses that meet the same need with a different offer: a supermarket that also sells bread, in the case of a bakery; a fast-food outlet, in the case of a traditional restaurant.
To map this competition, several sources exist: field observation remains irreplaceable (counting passers-by, observing peak hours), but official business registers allow a quick and reliable first census, with the activity code (NAF), the creation date, and the active-or-closed status. This is exactly the kind of census an online market study can automate — in seconds rather than hours of manual research.
The goal isn't only to count competitors, but to identify what isn't covered: a price segment, a time slot, a type of product. That's often where the real opportunity hides.
Step 6 — Go on site to confront the data with reality
Hard numbers give a reliable snapshot, but they never replace a visit on site. Once your desk research is done, it remains essential to verify on the ground:
- The sidewalk width and the storefront's visibility
- Nearby parking options
- Traffic direction and pedestrian accessibility
- The real atmosphere of the neighborhood at different times of day
- The nature of surrounding businesses (a street of food shops is often quiet in the afternoon)
This field stage also lets you talk directly with neighboring shopkeepers — often a goldmine of information about the reality of the neighborhood that neither statistics nor maps can convey.
How to turn this data into a decision
Once the five blocks of information are gathered — catchment area, demographic profile, footfall, competition, field observations — the decision is built by comparing several candidate locations on the same criteria. A simple grid usually suffices:
| Criterion | Location A | Location B |
|---|---|---|
| Primary-zone population | ||
| Dominant demographic profile | ||
| Footfall at key hours | ||
| Number of direct competitors | ||
| Visibility / accessibility | ||
| Rent per m² |
What matters isn't finding the location that's perfect on every criterion — it almost never exists — but the one whose profile best matches your specific concept. A premium concept will position itself differently from an accessible one, even within the same city.
To see how artificial intelligence makes it possible to compare several candidate locations in minutes rather than days, read our article on how to run a location study with AI in 10 minutes.
How much does a market study cost, and should you do it yourself?
Hiring a specialized geomarketing firm for a complete study typically costs between €3,000 and €8,000, with a turnaround of several weeks. That's a relevant budget for a heavy investment or a franchise network to size across several locations.
For an independent shop or a small chain, it's entirely possible to run this study yourself with an online market study. Catchment-area data, IRIS statistics, and competition registers are now accessible directly online, with no technical expertise or costly specialized software. Many tools even offer a free market study in a basic version — enough to start a first analysis before investing in more advanced features.
Conclusion
A solid market study doesn't guarantee a business's success — nothing ever fully does — but it eliminates most avoidable location mistakes. Catchment area, demographic profile, footfall, competition, and a field visit: these five pillars, tackled in order, give a complete enough picture to decide with confidence.
Test your catchment area and the demographic profile of your future location for free on SMAPS-AI — a free market study, accessible directly online.
app.smaps-ai.com
